Great analysis on horrible visualizations. See entire analysis. here: Top 10 Worst Graphs
|
|

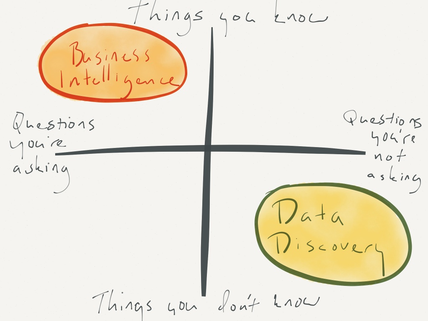 Are you asking the right questions? Are you exploring your data?
Recently we explored the difference between radiology turnaround time from a couple of metrics. We were not content with just TAT average for the practice. Questions we asked: How does the TAT differ from an average over last 3 months? What is the trend by hours of the workday? Is there any difference in TAT by day of the week? What is the TAT for referring physicians? Great, quick video from Clayton Christensen on understanding the job your customer wants to accomplish.  Below is a portion of an article (and a download of the entire article itself) published in Imaging Economics, that gives 4 good points on improving your medical imaging practice.
Repost from Clinical-innovation.com NEW ORLEANS—A sound business analytics strategy can help meet regulatory requirements, navigate reimbursement changes, and improve business efficiency through enterprise-wide data integration, according to a March 6 presentation at the Health Information and Management Systems Society (HIMSS) annual conference.
Re-post from Clinical-Innovation.com NEW ORLEANS—When considering your patient data, “it doesn’t help to know what happened 30 days ago. It’s too late,” said Mical DeBrow, PhD, RN, Siemens Clinical Strategic Consulting, speaking during a March 5 education session at the Health Information and Management Systems Society (HIMSS) annual convention.
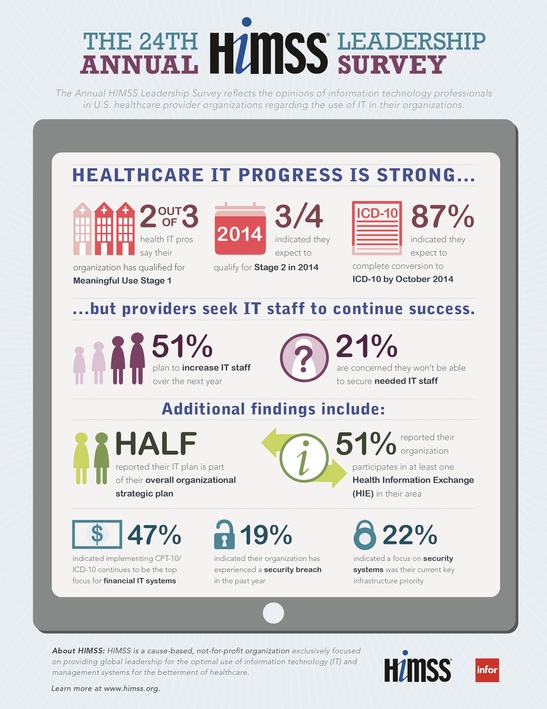 Earlier today, HIMSS announced the results of the 24th Annual HIMSS Leadership survey, which are visually displayed above. Visit the HIMSS press room to read the full release.
San Diego, Calif based Bern Medical launched their latest business analytics product, Metrics for the Masses. David Fuhriman, Bern's CEO explained: "Radiology has to do more with less- everything counts. The groups and imaging centers that are using their data effectively are and will continue to outperform those that don't. But, less reimbursements means smaller budgets. We've listened to the things practices have said across the country and developed a process to do the impossible."
Metrics for the Masses is a package of 101 data visualizations for clinical or financial data- delivered in an easy to use dashboard. There are no installation charges, no long term contracts, no additional software to purchase, and no limitations on number of users. Metrics for the Masses can integrate data from any system and can be up and running within one week. David continued "This is an incredible achievement that literally was impossible until recently." 
There are only 64 spaces and there are 16 pieces each. How many possible move combinations are there?
More from Taleb. Hope you enjoy. |
BERN BLOGBlog written by: Other Useful blogsArchives
June 2013

|
