Steve Blank is a consulting associate professor at Stanford University and a lecturer and National Science Foundation principal investigator at the University of California at Berkeley and Columbia University. He has participated in eight high-tech start-ups as either a cofounder or an early employee.
WHY THE LEAN START-UP CHANGES EVERYTHING
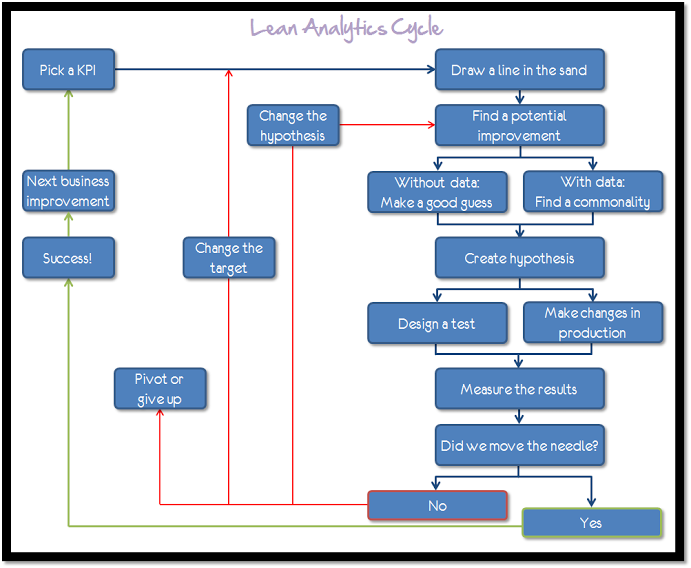
Great visualization produced by Avinash Kaushik - The Lean Analytics Cycle is a simple, four-step process that shows you how to improve a part of your business.
First, you figure out what you want to improve; then you create an experiment; then you run the experiment; then you measure the results and decide what to do. The cycle combines concepts from the world of Lean Startup — which is all about continuous, iterative improvement — with analytics fundamentals. It helps you to amplify what’s proven to work, throw away what isn’t, and tweak the goal-posts when data indicates that they may be in the wrong place.
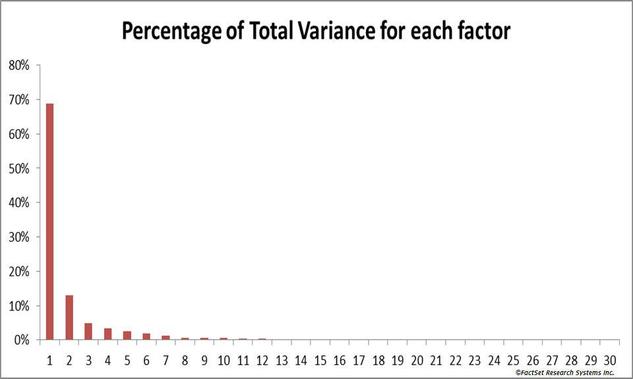
This graph shows the relative role of independent factors in a system of 30 identifiable factors. Over 80% of the variations can be attributed to the first 2 factors. In a system with “fat tails” it will be even more concentrated with 99.999% coming from one single factor.
If you are right on Factor 1 (and possibly 2) the rest is irrelevant. The problem is that others will drag you into factors 3 through 99. All this does is distracts from the core issue. Others will want to cover all sides of an issue, because those issues do impact the variance. But it only drives you to the irrelevant and drowns your Factor 1 argument. If you do things right, you should have only one argument. So, what is your Factor 1? It isn’t always intuitive. As Leonardo da Vinci is attributed to have said, “Simplicity is the ultimate sophistication” It can take a lot of effort to separate out these factors, to understand clearly the variances and to make the complex simple. The promise of analytics should be to help you identify your Factor 1. Once you know what it is, don’t allow anecdotal evidences, politics, incompetence, and the difficulty of solving Factor 1 prevent you from taking it on. Below is the text of The Final Speech of the Great Dictator, delivered by the character, the Jewish Barber, in Chaplin’s 1940 film, The Great Dictator. The Jewish Barber was played by Sir Charles Chaplin. Thursday April 11, 2013 I will be presenting 5 Tips for Creating Compelling Dashboards
Here is an overview: Do you spend more time creating a report than analyzing the data? Does your organization use the same reports they did 5 years ago? Creating dashboards is an important part of being able to quickly understand data. The last few years have seen several advances in the visual display of quantitative information. We understand now more about how our brain and eyes can understand information. There are several new tools in the recent years that make reporting faster and less error prone. We will cover common dashboard pitfalls and explore new techniques. At the end you can take some practical advice with you on how to refresh and improve your reporting. You will learn to:
(To see the entire powerpoint presentation clicl "Read More") |
BERN BLOGBlog written by: Other Useful blogsArchives
June 2013
|


