BERN MEDICAL
  • Home
  • Solutions
    • Radiology
    • About Data Visualization
    • Other Services

Anyone who has more than 3 PRIORITIES, doesn't have any

1/30/2013

 
Picture
Another DBrief from Deloitte on The Performance Imperative: Reaching Beyond Cost Cuts and Product Delivery Improvements. 

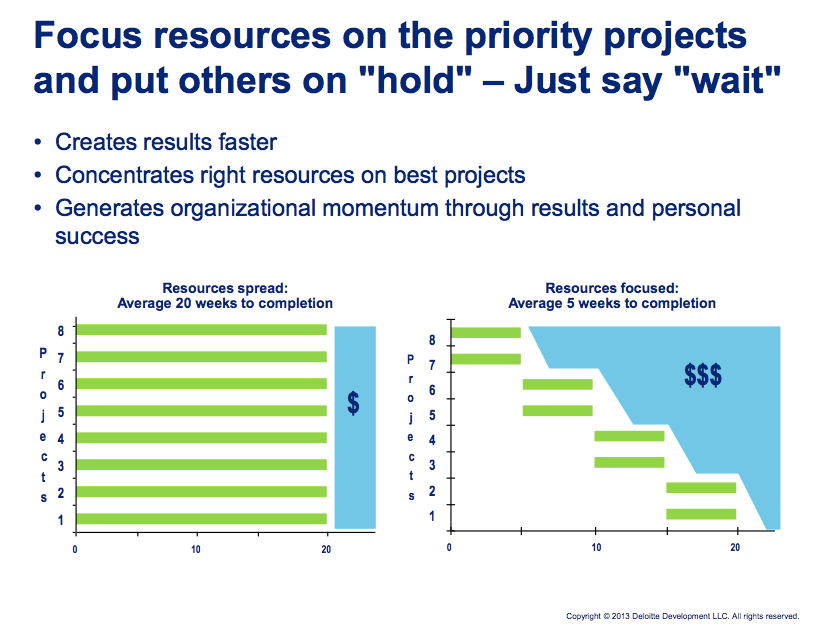
Great slide that I think relates to radiology and improving processes and the business. Often we make a list of 8 projects and we know they all need to be done, so we do them all at once. We need to improve referrals, RVU productivity of reading radiologist and modify workflow to increase productivity- among others. Instead of trying to tackle all of them at once, split them up and complete them one at a time, as the graph above demonstrates. 
Performance Imperative
File Size: 320 kb
File Type: pdf
Download File

Doctor: Pencil pulled from tot's head 'very, very slowly'

1/30/2013

 
Picture
Great story, worth sharing.

Read More

Managing Health: Moving from Volume to Value

1/24/2013

 
Great presentation today by Deloitte- Check out the Slides below and watch the Dbrief online.
dbriefs_012413_hs_slidefinal.pdf
File Size: 285 kb
File Type: pdf
Download File

Picture

Brand is an emotional attachment

1/24/2013

 
A company’s brand can can either catapult them to success or put them on the fast track to failure. In this talk from Chicago Founder Institute mentor, Joe Bezdek, Joe advises founders on brand development, providing them with tips and tricks to establishing an emotional connection with customers. Afterall, its not about being the biggest and the best - its about providing a positive and memorable experience.

Joe Bezdek is a co-founder of DivX, Inc., the creator of the popular DivX video format and technology. While at DivX, he filled a variety of roles in product management, marketing, and brand management, most recently as brand director.

Joe concludes his talk with some lessons in naming; he says that a company’s name is a vessel for the brand essence. A good vessel should reinforce the emotional connection and experience customers have with the product.
Clicking on the video below will open a link to the FI page and the video
Picture

Signal and the Noise- Aging Curve

1/18/2013

 
Picture
In Nate Silver's book "The Signal and the Noise"- are included a couple of interesting graphs. These graphs demonstrate very well the difference between noise and signal and the difficulty of prediction. The image above are line graphs of the hitting performance of professional baseball hitters. Each line is a different hitter. 

Below is the graph for the "signal" the aggregate trends. What do you see in your life or profession that may resemble the graph above, but understand the graph below would help?
Picture

#8- Architecture of Business Intelligence (Big Data)

1/11/2013

 
Picture
This is a review of a chapter from ""Competing on Analytics"-
Signposts of Effective IT for Analytical Competition:
  • Analysts have direct, nearly instantaneous access to data
  • Information workers spend their time analyzing data and understanding its implications rather than collecting and formatting data
  • Managers focus on improving processes and business performance, not culling data from laptops, reports and transaction systems
  • Data is managed from an enterprise wide perspective throughout its life cycle, from its initial creation to archiving or destruction
  • A hypothesis can be quickly analyzed and tested without a lot of manual behind the scenes preparation beforehand
  • Managers never argue over whose numbers are accurate
  • Both the supply and demand sides of the business rely on forecasts that are aligned and have been developed using a consistent set of data
  • High volume, mission critical decision making proceses are highly automated and integrated
  • Data is routinely and automatically shared between the customers and suppliers
  • Reports and analyses seamlessly integrate and synthesize information from may sources
  • Rather than have data warehouse or business intelligence initiatives, companies manage data as a strategic coporate resource in all initiatives

How can we make data more valuable?
  1. It is correct
  2. It is complete
  3. It is current
  4. It is consistent
  5. It is in context
  6. It is controlled


#7 Managing Analytical People

1/11/2013

 
Picture
This is a review of a chapter from ""Competing on Analytics"-
Characteristics of Analytical Executives:
  • They should be passionate believers in analytical and fact based decision making. You cannot inspire others to change their behavior in a more analytical direction if oure not passionate about the goal. 
  • They should have some appreciation of analytical tools and methods. They need not be analytical experts, but they should have an understanding of the tools and qualitative assumptions that are a part of the analytics.
  • They should be willing to act on the results of the analyses. The "action" stage is the most important piece of analytics. There is no point in commissioning detailed analytics if nothing different will be done based on the outcome. 
  • They should be willing to manage a meritocracy. It will become apparent who is performing and wh isn't. Those that are performing should be rewarded; those who don't perform shouldn't be string along for long periods. Nothing good comes from inaction when performance differences are visible. 

My Thoughts: 
This chapter is not very well done. It's focus is on the executives that manage analytical talent and not actually managing the analytical talent. One of the best books I have ever read is "Leading Geeks: How to manage and lead people who deliver technolgy" -- I don't expect this level of treatment in this book, but I do expect something better than analytics needs executive support- and then once executive support is there, that analytics will magically work well. It won't- most of the examples from the book are from organizations that are lead by people with an analytical background. The reader would be better served with an analysis of what these leaders did to encourage their talent.

#6- Road Map to Enhanced Analytical Capabilities

1/11/2013

 
Picture
This is a review of a chapter from ""Competing on Analytics"-
Questions to Ask when Evaluating New Analytical Initiatives:
  • How will this investment make us more competitive?
  • How does the initiative improve our enterprise-wide analytical capabilities?
  • What complementary change need to be made in order to take full advantage of new capabilities, such as developing new or enhanced skills; improving IT, training, and processes; or redesigning jobs?
  • Does the right data exist? If not, can we get it? Is the data timely, consisten, accurate, and complete?
  • Is the technology reliable? Is it cost-effective? Is it scalable? Is this the right approach or tool for the right job?

Some missteps are due primarily to ignorance. Most common errors of omission are:
  • Focusing excessively on one dimension of analytical capability (e.g. too much technology)
  • Attempting to do everything at once
  • Investing excessive resources on analytics that have minimal impact on the business
  • INvesting too much or too little in any analytical capability, compared with demand
  • Choosing the wrong problem, not understanding the problem sufficiently, using eh wrong analytical technique or the wrong analytical software
  • Automating decision-based applications without carefully monitoring outcomes and external conditions to see whether assumptions need to be modified

My Thoughts:
There is here an element of risk. What will be the expected outcome based on the implementation of analytics? What does the upside look like and what is the downside? Analytics should be looked at like any other investment. What is the return? What costs can be reduced? How much more revenue can we increase? At the heart are always these assumptions. Other considerations are important, too. How much faster could we move? Can we increase throughput? Are our clients demanding better analytics with our product or service? 

The costs of delivering analytics has dropped a lot in the past 5 years. Better software and cheaper software. It has become crucial pieces of some industries- while others are just starting to wonder what could be...

The Signal and the Noise- Introduction

1/10/2013

 
Picture
This is a chapter review of "The Signal and the Noise. Why so many predictions fail- but some don't" by Nate Silver
The invention of the printing press changed the trajectory of mankind. Recording information in books was costly, error prone and subject to decay and loss. Everything would soon be forgotten. Books allowed us to store and share information and grow at an exponential rate. 

With all of this data that we have now- so has the expectation that we will be able to predict the future. "The signal is the truth. The noise is what distracts us from the truth. this is a book about the signal and the noise."

My Thoughts:
I appreciate the approach to truth and the distinction to noise, or not truth. I just received this book- today. So, looking forward to reading and posting my thoughts on this blog.

#5- Competing on Analytics with External Processes

1/8/2013

 
Picture
This is a review of a chapter from ""Competing on Analytics"-
Analytical competitors look beyond basic statistics and do the following:
  • They use predictive modeling to identify the most profitable customers- as well as those with the greatest profit potential and the ones most likely to cancel their accounts.
  • They integrate data generated in-house with data acquired from outside sources for a comprehensive understanding of their customers
  • They optimize their supply chains and can this determine the impact of unexpected glitches, simulate alternatives, and route shipments around problems
  • They analyze historical sales and pricing trends to establish prices in real time and get the highest yield possible from each transaction.
  • They use sophisticated experiments to measure the overall impact or "lift" of advertising and other marketing strategies and then apply their insights to future analyses.  
Typical Analytical Applications in Marketing
  1. CHAID- h-square automatic interaction detection. Used to segment customers on the basis of alternative variables. 
  2. Conjoint analysis- Typically used to evaluate the strength and direction of customer preferences for a combination of product or service attributes. Determine which which factors (price, quality, location...) are most important.
  3. Lifetime value analysis- Analytical model to assess the profitability of an individual customer over a lifetime of transactions. Other models generate estimates of costs incurred by the customer in purchasing and expenses from call centers. 
  4. Market experiments- Using direct mail, changes in the Web site, promotions, and other techniques, marketers test variables to determine what customers respond to most in a given offering. 
  5. Multiple regression analysis- Most common statistical technique for predicting the value of a dependent variable (sales) in relation to one or more independent variables (number of salespeople, temperature, day of the month). While basic regression assumes linear relationships, modification of the modela can deal with non-linearity, logarithmic relationships etc...
  6. Price optimization- Also known as yield or revenue management, this technique assumes the primary causal variable in customer purchase behavior is price. Key issue is usually price elasticity. 
  7. Time series experiments- Experimental designs to follow a particular population for successive points in time. Could be used to determine the impact of exposure to advertising. 
Typical Analytical Applications in Supply Chains
  1. Capacity planning- Finding capacity, identifying and eliminating bottlenecks.
  2. Demand-supply matching- Determining intersection of demand and supply curves to optimize inventory and minimize overstocks and stock-outs. Typically involves such issues as arrival processes, waiting times, and throughput losses.
  3. Location analysis- Optimization of locations.
  4. Modeling- Creating models to simulate, explore contingencies, and optimize supply chains.
  5. Routing- Finding the best path for delivery around a set of locations.
  6. Scheduling- Creating detailed schedules for the flow of resources and work through a process. 

My Thoughts: This chapter has much of the meat that was lacking in the previous chapter. Again, notice that we are moving beyond just reporting. 
<<Previous

    BERN BLOG

    Blog written by:
    David Fuhriman, CEO
    Contact Me

    Other Useful blogs

    Occam's Razor
    Six Pixels
    Junk Charts
    Kaizen Analytics
    Zoom Metrix

    Archives

    June 2013
    May 2013
    April 2013
    March 2013
    February 2013
    January 2013
    December 2012
    November 2012
    October 2012
    September 2012
    August 2012
    July 2012
    June 2012
    May 2012
    April 2012
    March 2012
    February 2012
    January 2012
    December 2011
    November 2011
    October 2011
    September 2011
    August 2011

    Springboard
Powered by Create your own unique website with customizable templates.