
Great visualization produced by Avinash Kaushik -
http://www.kaushik.net/avinash/lean-analytics-cycle-metrics-hypothesis-experiment-act
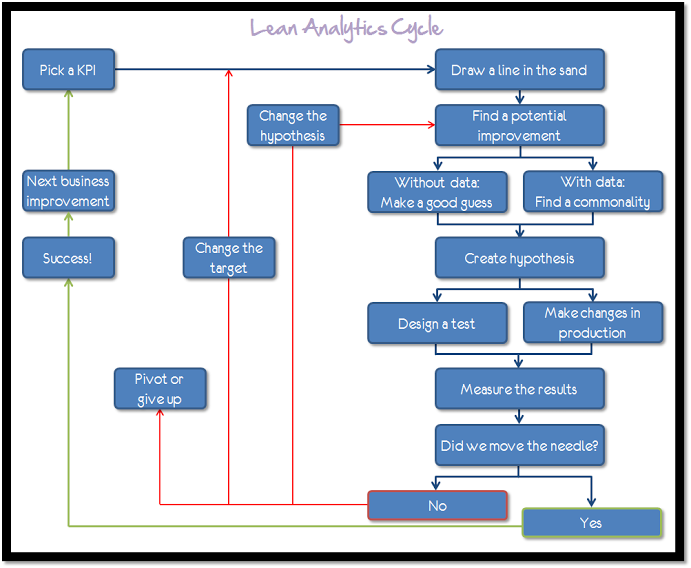
The Lean Analytics Cycle is a simple, four-step process that shows you how to improve a part of your business.
First, you figure out what you want to improve; then you create an experiment; then you run the experiment; then you measure the results and decide what to do.
The cycle combines concepts from the world of Lean Startup — which is all about continuous, iterative improvement — with analytics fundamentals. It helps you to amplify what’s proven to work, throw away what isn’t, and tweak the goal-posts when data indicates that they may be in the wrong place.
- Figure out what to improve
- Form a hypothesis
- Create the experiment
- Measure performance and decide what to do