
In Nate Silver's book "The Signal and the Noise"- are included a couple of interesting graphs. These graphs demonstrate very well the difference between noise and signal and the difficulty of prediction. The image above are line graphs of the hitting performance of professional baseball hitters. Each line is a different hitter.
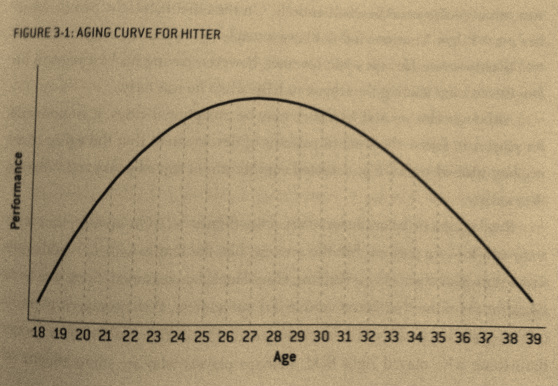
Below is the graph for the "signal" the aggregate trends. What do you see in your life or profession that may resemble the graph above, but understand the graph below would help?
Below is the graph for the "signal" the aggregate trends. What do you see in your life or profession that may resemble the graph above, but understand the graph below would help?